Ohm’s law V–I graph
Straight line through origin at constant temperature; slope related to R.
Step 1 — Study the figure
Cover the label key on the image, name each numbered part, then check the explanations below.

Step 2 — Diagram details for students
What this diagram shows
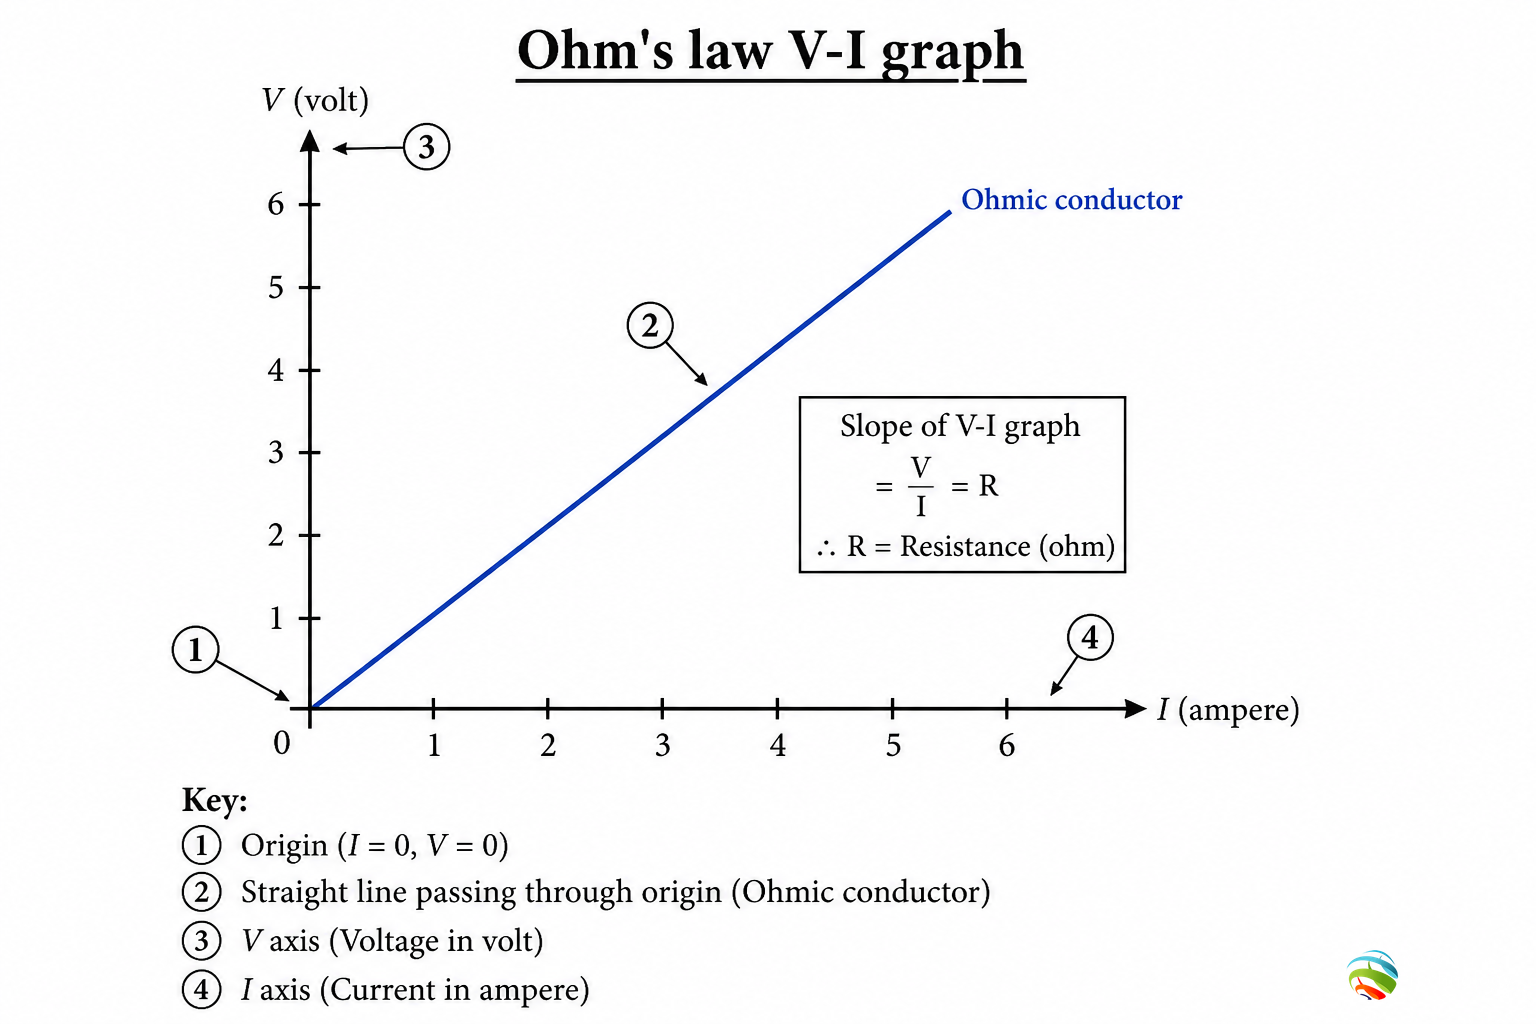
Ohm’s law says that at constant temperature, potential difference V is proportional to current I for many conductors. The V–I graph is a straight line through the origin, and resistance relates to the slope. Always state the constant-temperature condition.
Numbered parts — mark & remember
Match each number on the figure with the meaning below. Say the function aloud once.
1 V axis
Potential difference is plotted usually on the y-axis in school graphs. Unit is volt (V). It is the cause that drives current through the resistor.
2 I axis
Current is plotted on the x-axis with unit ampere (A). It is the effect measured by an ammeter in series. For ohmic conductors, I rises in proportion to V.
3 Straight line through origin
A straight line through the origin shows V ∝ I. This is the graphical statement of Ohm’s law under constant temperature. Non-ohmic devices may give curves.
4 Slope and resistance
Resistance R = V/I from any point on the line for an ohmic conductor. Graphically, slope relates to resistance depending on axis choice. Unit of resistance is ohm (Ω).
How to read this figure
- Linearity + origin means ohmic behaviour.
- Quote constant temperature in definitions.
- Calculate R from a clear data point if asked.
Redraw for board marks
- Draw labelled V and I axes.
- Draw a straight line through origin.
- Mark one point and compute R = V/I beside it.
Board answer tip: State Ohm’s law with condition, draw V–I graph, and calculate R from one point.
Exam tips — don’t lose marks
- Missing “constant temperature” loses definition marks.
- R = V/I, not I/V.
- Heating can change resistance and break strict ohmic behaviour.